Debugging Macros
Macros can encounter various error conditions while executing. These errors can relate to missing files, disconnected network devices, incorrect user input or many other external scenarios. Such conditions can cause run-time errors in your code, which cannot always be avoided. One way of responding to these errors is to add error-handling to your macros, which allows you to respond to anticipated errors with specific logic.
Sometimes the macro itself contains an error. This type of error is commonly referred to as a bug. The process of locating and fixing bugs in your macro is known as debugging. Newlook provides several tools to help you analyze how your macro executes. These debugging tools are particularly useful in locating the cause of bugs, but you can also use the tools to experiment with changes to your macro.
BE AWARE:
To use Newlook's debugging tools, Microsoft Script Debugger must be installed on your machine. This toolset will already be installed on your machine if you have installed MS Visual Studio. If you are having trouble getting breakpoints or stepping working, please contact our support team at [email protected] and we can assist you to check and install Microsoft Script Debugger if required.
Running your macro with debugging enabled
To run the current macro with debugging turned on, select Debug > Debug'<macro name>' from the main menu. Running a macro with debugging enabled allows you to step through your code, evaluate expressions in Inspector and the Watch window and pause execution at any breakpoints.
Stepping through your macro
To execute your macro line by line while debugging, you can either hit F11 or select Debug > Step Into ( ) from the main menu. When you step through a macro, any nested macros will also be stepped into.
TIP:
As you execute each line of code, you can use Inspector to view the current state of object properties or variables.
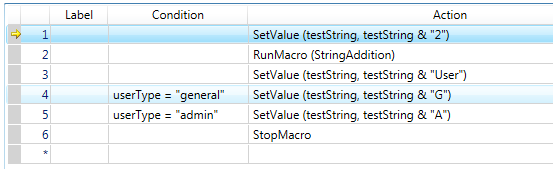
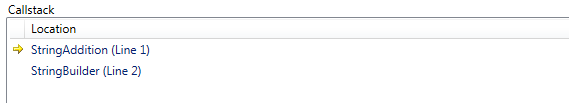
As you step through a macro, the yellow arrow in the left margin indicates the row that will execute next. The callstack window also shows you the line of your macro that will execute next plus and macro calls that are currently on the stack. This can be a useful way of examining the execution flow if you have nested macros.
Stepping over and out
When you are stepping through lines in a macro, any macro that is called (via a GoToMacro or RunMacro action) will also be stepped into. If you want to skip the execution of any called macros, you can hit F10 or Debug > Step Over ( ) to avoid stepping through the called macro (the called macro will still execute, but the debugger skips over them). It is also possible to step out of a called macro (execute the remainder but pause when execution returns to the calling macro) by pressing Shift + F11 or Debug > Step Out (
 ).
).
Breakpoints
An alternative to stepping through your macro, is to set breakpoints in your macro. Breakpoints are useful when you wish to debug only a specific area of your macro.
A breakpoint halts the execution of the macro just before the row is executed, giving you a snapshot of the macro's condition at that point. Variable and property settings are preserved, so you can analyze the current state of the macro.
When an application is in break mode, you can:
- Observe the condition of the Newlook interface.
- Determine which active macros have been called.
- Watch the values of variables, properties, and objects.
- View which action is going to be executed next.
You can insert a breakpoint on a particular row of your macro by clicking the far left margin of the row. Alternatively, you can select the row you wish to break on and hit Debug > Toggle Breakpoint ( ) to toggle a breakpoint on or off. The breakpoint appears as a red dot in the left margin.
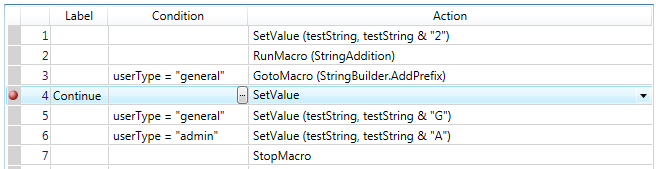
When you run a macro or your solution in debug mode, execution pauses at the breakpoint, before the action on that row is executed.
To remove all breakpoints in your solution, press Debug > Clear All Breakpoints (![]() ).
).
Run to cursor
When the execution of your macro is paused at a breakpoint, it is possible to position your cursor further down your macro and select Debug > Run to Cursor ( ) to continue execution to your cursor position.
More in this Section...
How to use the Inspector window to assist in debugging.
Some ideas to help simplify debugging.
An overview of error handling in Newlook.
See Also
Writing and Debugging Macros | Runtime Error reference | Developer Menu Options