Newlook Insights

Newlook Insights allows Newlook administrators to configure Smartclient to capture information from end-users about their navigation habits; including which screens and fields are most used.
It is primarily used to gain information about the way that an application is used by its end-users in order to identify areas of an application that will benefit the most from modernization. In order to understand and analyze user behavior, you need to record it. Once the recordings are done, they are imported into Newlook Developer, and represented as a graph. There is no limit on the number of recordings that can be imported. The more recordings added - the more accurate the graph will be. Recordings can also be imported as a specific group so that you can compare usage across different departments or individuals.
The advantage of the Newlook Insights tool is that it allows you to concentrate your effort on those screens, fields and processes that are most commonly used.
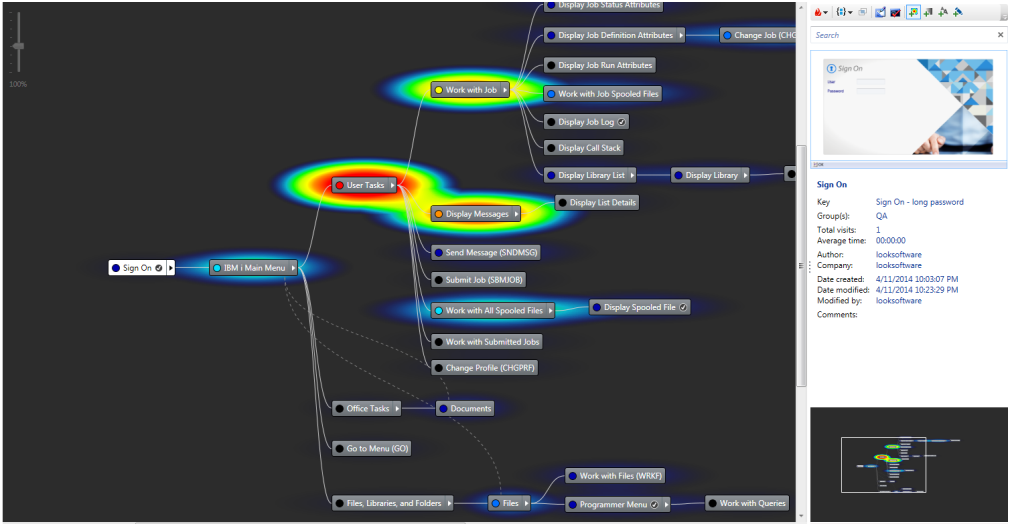
There are many different options for displaying graphs, including color-coding, heat maps or line graphs. The graphs can be rendered by visit or by time spent, and configured to show specific key information or all the available data.
Next Steps
See Also
Recording user data | Importing recording files | Using an Insights Graph